 Break Above $0.68 Resistance or Slip Below $0.60 Support?")
- Ethena consolidates near $0.6589, with $0.68 resistance and $0.60 support defining short-term direction for ENA/USDT traders.
- Daily chart shows price holding above 50-day EMA and Supertrend, signaling cooling after August’s rally while buyers maintain momentum.
- Breakout above $0.68 could target $0.703, $0.729, and $0.774, while a breakdown risks a decline toward $0.603 base level.
Ethena (ENA) is consolidating in a tightening triangle, with $0.68 marked as breakout resistance and $0.60 standing as major support.
ENA Compresses Within Triangle Formation
Crypto analyst Ali shared that Ethena is consolidating in a triangle on the one-hour timeframe. The price trades near $0.6589 as of writing, hovering above the 0.618 Fibonacci retracement at $0.6643. This positions ENA close to the upper triangle boundary at $0.68, which aligns with the 0.5 Fibonacci level.
A bullish continuation breakout above $0.68 would be a buy signal, with targets towards $0.703, $0.729 and the previous swing high at $0.774. If the price does not continue to move, then short term support is at the rising trendline of the structure.
On the lower side, $0.636 at the 0.786 Fibonacci level becomes the next zone to monitor. A breakdown below $0.603, the base of the triangle and 1 Fib extension, would confirm bearish pressure taking control.
Daily Chart Points to Cooling After Rally
The daily ENA/USDT chart shows the market cooling after a rally that peaked near $0.85. Current consolidation is seen around $0.63, where price holds above the 50-day EMA at $0.5985. The Supertrend indicator also supports the market at $0.5782, forming a strong decision point.
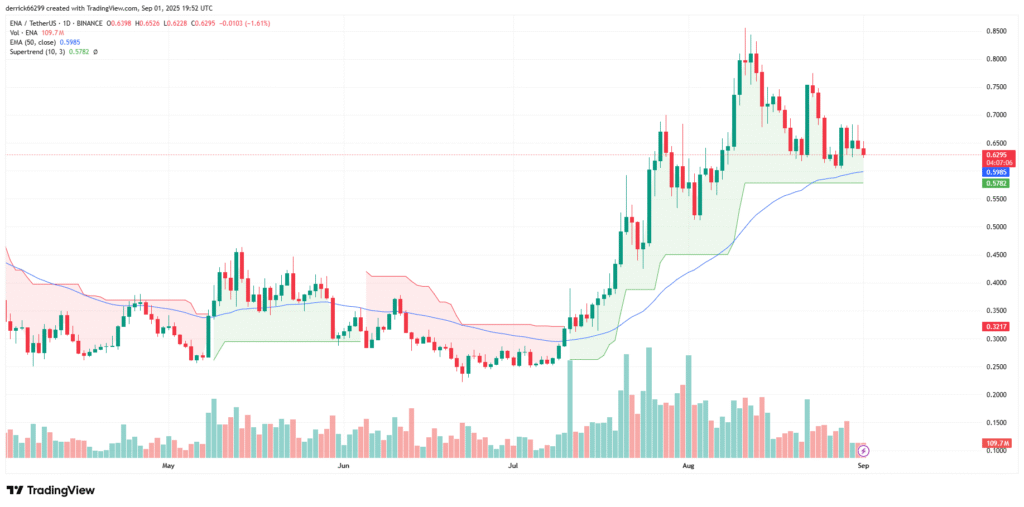
So long as buyers continue to support the trend, a recovery toward $0.70-$0.75 is possible. On the other hand, if these zones are not defended, then a slide towards $0.55 is close, where downside risk increases.
Trading volume has also tapered off since mid-August, indicating reduced speculation. Despite softer demand, the price remains above both the EMA and Supertrend, maintaining a technical advantage for bulls if momentum revives.
Key Levels Define Next Direction
The $0.68 level now stands as the decisive resistance to monitor.A confirmed bullish break above would add to gains toward prior highs, rekindling bullish sentiment across the market.
A breach of the structure results in $0.636 near-term support, but ultimately $0.60 remains buyers’ final line in the sand.Losing this threshold could trigger sharper downside, suggesting further correction before recovery attempts.
The triangle consolidation signals a make-or-break stage for Ethena. Traders now watch closely whether ENA powers through resistance or slips into deeper retracement.