
- Pendle’s price sits near the 0.618 Fibonacci retracement and the ascending channel lower trendline, creating a potential support zone at $4.70.
- Weekly trading volumes surged from $250 million in 2024 to over $1 billion, reflecting increased market activity and liquidity for Pendle ($PENDLE).
- The Fibonacci extension at $7.60 aligns with the channel’s upper boundary, establishing a measurable target for the next upward price movement.
Pendle ($PENDLE) is approaching a potential support level at $4.70. Technical indicators show a convergence of Fibonacci retracement and an ascending channel lower boundary, while the next target could reach $7.60.
Technical Analysis Shows Support Levels
Pendle’s chart displays an ascending channel, indicating a steady upward trend. The current price is near the 0.618 Fibonacci retracement level at $4.79, a zone previously associated with price stabilization.
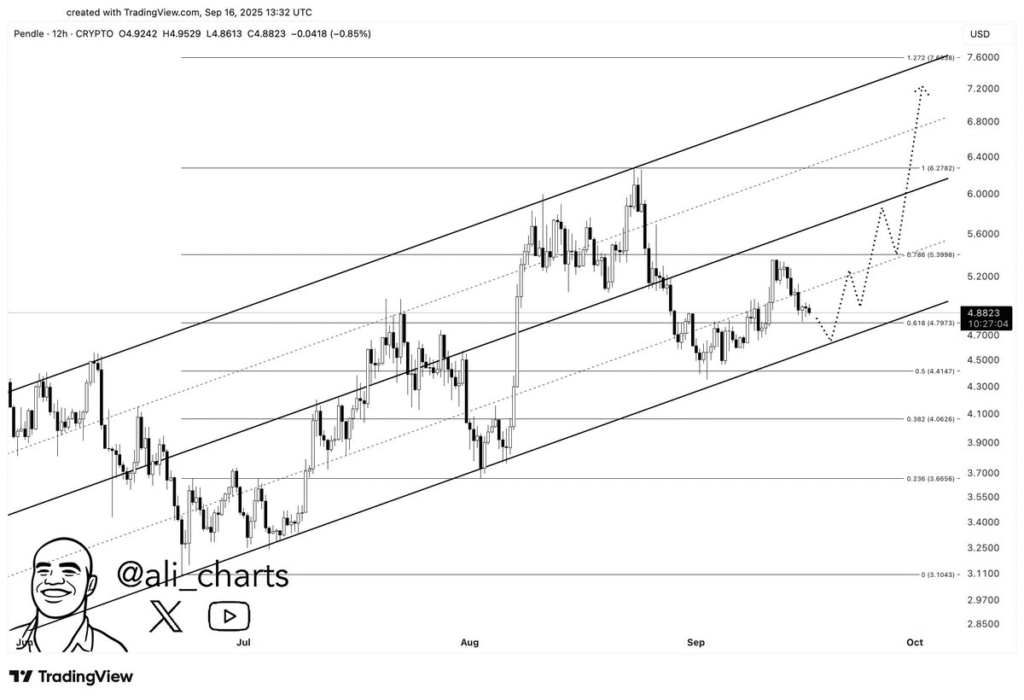
A dip to $4.70 aligns with the lower trendline of the ascending channel. This level is aligned with major Fibonacci support and has been compared with the price rebounds in the channel.
The extension of the Fibonacci at the 1.272 level of $7.60 is a possible future price. A move from $4.70 to this extension indicates a measurable range of upward movement within the channel.
Market Activity and Metrics
Pendle is ranked as the sixth-largest DeFi protocol by size. ts market cap stands at about $880 million, and total value locked (TVL) has risen to $12.3 billion, an increase of 51% in the past month.
Volumes of lifetime trading have reached above 38 billion and yearly fees are approximately 72 million. These figures indicate consistent market engagement and protocol activity.
Weekly trading volumes have increased from $250 million in 2024 to over $1 billion recently, according to NaveenCypto. The rise in volume reflects higher liquidity and greater transaction frequency within the protocol.
Price Levels and Potential Targets
The $4.70 level represents a convergence of Fibonacci support and the ascending channel’s lower trendline. Price interactions at this level have previously coincided with upward movement within the channel.
If the price reaches this zone and moves upward, the next target corresponds to the 1.272 Fibonacci extension at $7.60. The movement represents a defined range of potential price increase from the current level.
The ascending channel illustrates the trend’s boundaries. Movements toward the lower trendline align with support, while upward movements approach the $7.60 extension, providing a clear framework of price levels.