—Here’s How the Rally Could Unfold")
- PancakeSwap (CAKE) rebounded after sweeping liquidity between $2.55 and $2.60, shifting orderflow bullish and forming higher lows to signal renewed buyer defense.
- Analysts identify a fair value gap near $2.68 as a retracement zone, offering traders high-probability entries while maintaining structure above $2.55.
- A symmetrical triangle around $2.7 and rising momentum signals suggest CAKE could break higher, targeting the previous week’s high near $3.145.
Analysts are pointing to a bullish orderflow shift on PancakeSwap (CAKE), with liquidity sweeps, fair value gaps, and triangle consolidation shaping the potential path for an upcoming rally.
Liquidity Sweep Shifts Market Structure
Analysts monitoring PancakeSwap’s CAKE/USDT chart observed a sweep of sell-side liquidity between $2.55 and $2.60. The move cleared stops and triggered weak hand exits, but instead of continuing lower, price rebounded. This response suggested a structural shift in market orderflow.
Crypto Patel described the development as a textbook setup. The recovery marked a shift from bearish to bullish participation, with buyers stepping in aggressively. This behavior indicated that liquidity removal strengthened the bullish case rather than weakening it.
Following the rebound, CAKE began forming higher lows, signaling defensive buyer presence. Patel shared an execution plan focused on a retracement entry near $2.680, with the liquidity draw at $3.145 marked as the primary upside target.
Fair Value Gap as Key Retracement Zone
The structure revealed a Fair Value Gap (FVG) positioned around $2.68. Analysts noted that such zones often act as rebalancing areas where markets return before continuing higher. This setup offered traders a clear level for potential long positions.
As long as price holds above $2.55, the retracement into the FVG is expected to provide favorable entries. Analysts believe this technical alignment strengthens the probability of continuation toward the $3.145 target.
The bullish orderflow thesis remains valid while CAKE sustains higher lows. Maintaining structure above the liquidity sweep zone is crucial to supporting the rally framework. This makes the retracement into the imbalance zone a key focus for short-term participants.
Consolidation Patterns and Momentum Signals
Beyond the liquidity and gap levels, the broader weekly chart shows a symmetrical triangle forming near $2.7. Price is now approaching the apex, where consolidation typically resolves in a breakout. This aligns with the short-term bullish order flow narrative.
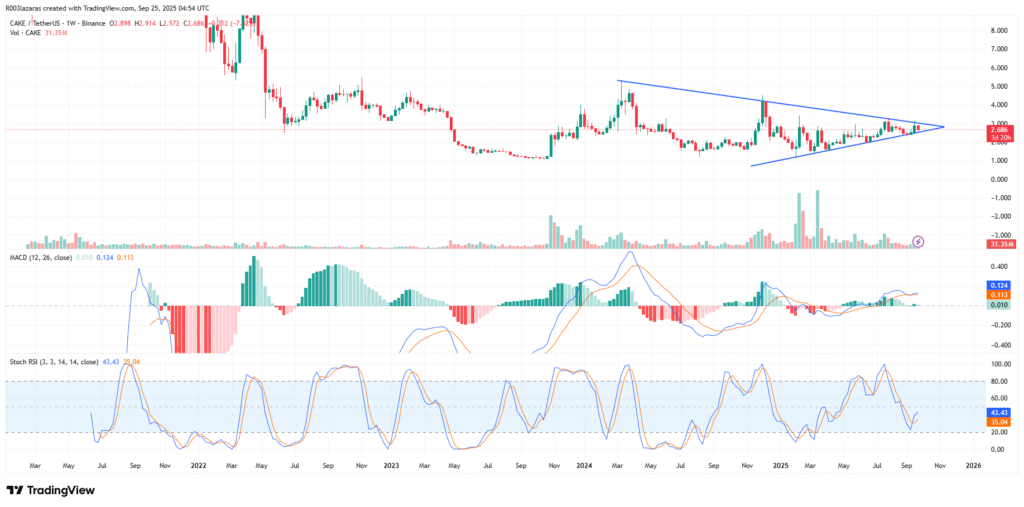
Volume has been gradually contracting, matching the typical behavior of markets inside symmetrical patterns. A decisive move will likely coincide with higher volume, adding confirmation to whichever direction the breakout takes.
Momentum indicators provide further insight. The MACD line remains slightly above the signal line, with positive histogram bars suggesting mild upward pressure. Meanwhile, the Stochastic RSI is climbing from neutral zones, showing potential for upward continuation without immediate overbought risks.