 Headed for New Highs or a $50 Correction?")
- Since December 2022, Solana is up 3,700%, bringing it to the [$225–$285] resistance region, which it would have to breach for any potential breakout momentum.
- Technical readings show cooling momentum with MACD and RSI, with $180 displaying support levels as bullish pressure weakens.
- A confirmed breakout above $285 could trigger renewed momentum toward $465–$1,000, reaffirming Solana’s long-term uptrend and market strength.
Since December 2022, Solana ($SOL) has achieved an amazing price increase of 3,700%, making it one of the strongest market assets out there. However, as price action ceases and stalls at around $184, traders are now wondering, will Solana move towards new all-time highs, or will it take a more in-depth retracement back to $50?
Solana Tests Its Critical Resistance Zone
After a steep ascent, Solana now faces a significant hurdle around the $225–$285 resistance region. Market analyst Ali _charts observed that this level has historically been a strong point of contention for the asset, countering the move between continuation and commencement of a corrective phase.
If buyers are able to support a confirmed weekly close above $285, the technical outlook may shift back into bullish territory, and a detonation of higher prices will validate an uptrend toward new highs of between $465 and $1,000, signifying a return of confidence from institutional buyers, and in this case, the market as a whole.
If buyers fail to reclaim the resistance range, a significant corrective wave could ensue. The next visible support levels are found around $135 and $105, with a potential deeper decline to the $50 area that presents to be significant due to a past area of accumulation and long-term value. Overall, this structure shows that the uptrend is intact, but the strength of the market is now being probed at a sizable area of contention.
Momentum Indicators Suggest a Cooling Phase
Technical indicators on the daily timeframe of Solana (SOL) show that the price momentum has reduced after several months of continuing up. Solana appears to be struggling to return back above the psychological $200 price level, indicating buyers might be getting more cautious.
The MACD lines are still below the zero level, with the signal line still above the MACD line, which has resulted in some bearish momentum remaining. However, the MACD histogram bars are shorter, showing that selling is fading and could allow for a risk-off relief bounce.
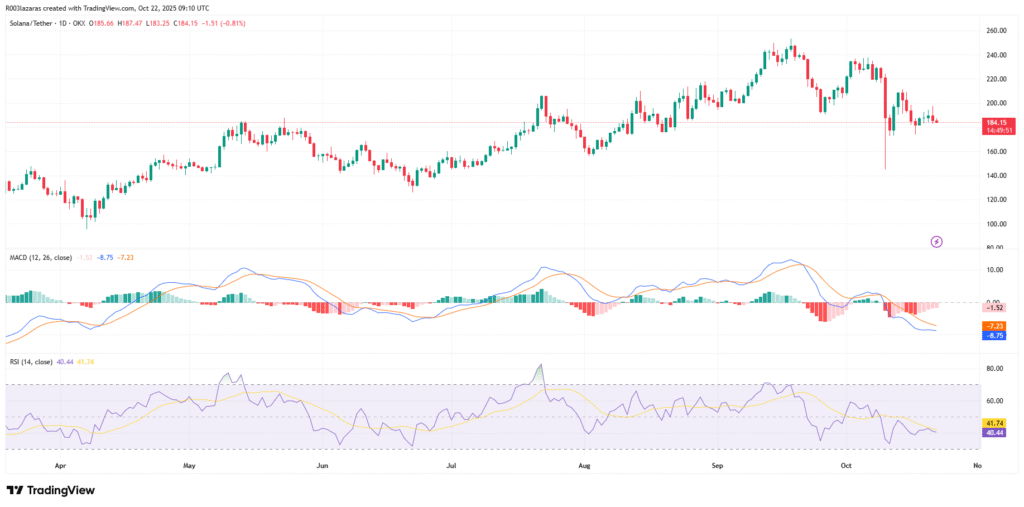
The RSI is hovering around 40, indicating the asset is shifting to oversold conditions but isn’t quite exhausted. If the asset cannot hold $180, downside price targets of between $160 and $150 may be a possible target. These two downside price levels provide prior support areas where buyers re-entered the market, which could provide short-term relief support zones.
A Crossroad Between Continuation and Correction
The price structure currently looks neutral for Solana, allowing both bullish and bearish possibilities to take shape. For the momentum to shift back higher, it will need a clear daily/weekly close above the $200-$205 area. If the price level gets penetrated, this will create bullish confidence and allow for a move up to the $230-$250 area.
Conversely, ongoing weakness beneath this area may suggest that a corrective period is coming into play. Volume suggests lower activity, as participants look to get more engaged in new positions once confidence and structures are restored.
Solana now finds itself at an important inflection point after one of the largest rallies in crypto history. Its ability to either gather strength for yet another breakout or roll back down to the $50 area will be determined by market reaction at the resistance band at $225-$285 in the weeks ahead.