
- Chainlink ($LINK) trades around the $23 resistance, and a breakout may prove a bullish wave that will proceed to the $24.60 and $27 levels.
- Technical indicators like the MACD and the RSI have improving momentum, which is an indication that the market could remain on its upward path in the near future.
- Chainlink also recorded a record high Total Value Secured (TVS), which indicates robust network expansion, which may have a positive impact on market valuation in the near future.
Chainlink ($LINK) will reach a pivotal moment as it tests the $23 area of resistance. Traders are watching closely, as several indications show that a breakout would lead to price action towards $27. The token has remained relatively strong since mid-2025, remaining higher than its long-term
Price Consolidates Beneath a Key Resistance
Analyst Ali charts have pointed out that Chainlink’s price structure remains confined within a descending channel. The $23 mark has functioned as a solid level of resistance, rejecting multiple attempts to advance. A clean break above this level can indicate the beginning of a new wave of bullishness, advancing to $24.60, $25.31, and even $27.
Technical configuration is also supported by Fibonacci retracement levels, with the 0.618 level lying in the same $23 area. Such convergence strengthens the argument of a likely breakout. If the price closes above it, then the subsequent Fibonacci level at $24.23 will be in focus, acting as a natural short-term target for traders.
Chainlink is trading at approximately $22.15 and is still respecting its uptrend line that has guided its price movement since June 2025. This consistent behavior reflects healthy structure, suggesting that buyers remain active even as the token consolidates near resistance.
Momentum Builds as Indicators Turn Positive
Momentum oscillators are now in favor of the bulls. The MACD has also turned positive in recent times with the blue line crossing over the orange signal line—a pattern often associated with increasing bullish energy. In the meantime, the green histogram bars have been increasing, pointing towards increasing buying pressure.
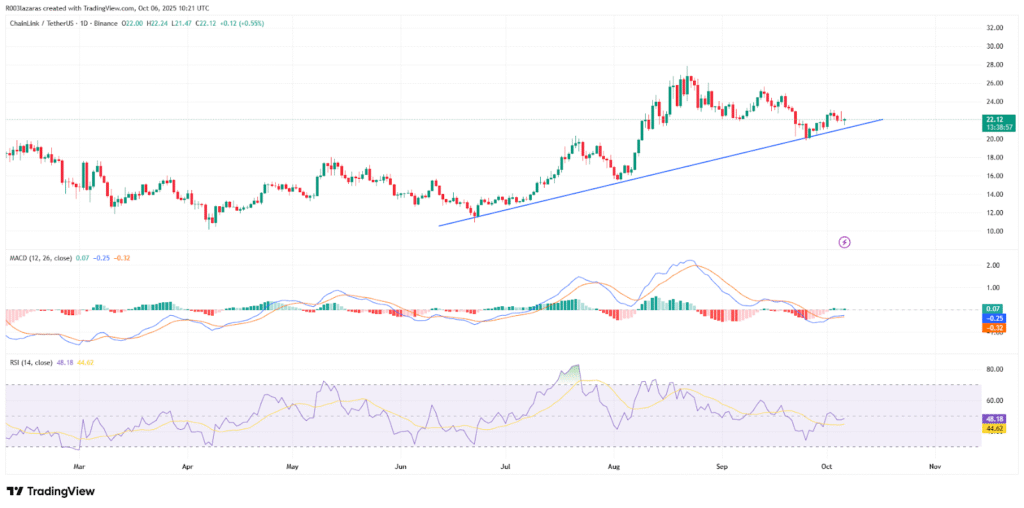
The Relative Strength Index (RSI) is around 48.40 and still rising, showing enhanced sentiment without any oversold information. This bull-neutral situation provides Chainlink room to keep on rising before hitting the overbought region. These indicators signal a market that is increasingly confident following weeks of range-bound trading.
But investors are holding back. A breakdown below $23 may lead to another pullback toward the $20 level of support, holding the token in the same range. The next few sessions will likely determine whether Chainlink transitions from consolidation to breakout.
On-Chain Metrics Support a Bullish Scenario
Supporting the technical picture, on-chain data paints a favorable backdrop. Chainlink’s Total Value Secured (TVS) has reached a new all-time high. In the past, these types of levels were often associated with price appreciation, as valuations often aligned with the protocol’s increasing usefulness.
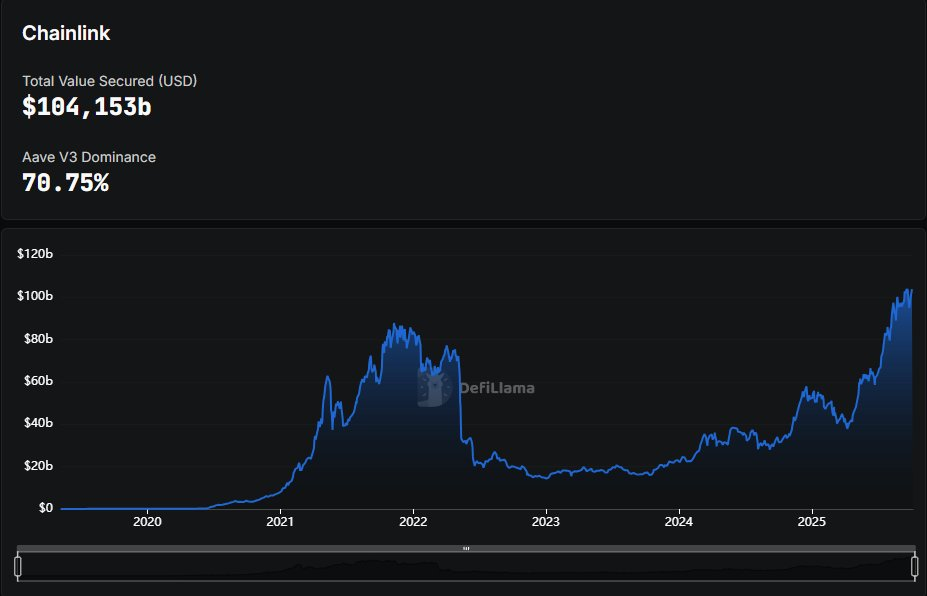
The growth in TVS represents the protocol’s increasing adoption in the DeFi space. In general terms, the more value Chainlink locks in across blockchain applications, the more confidence investors will have in Chainlink, and that can provide a basis for favorable price action in the coming quarters.
Both the improvement in on-chain metrics combined with the technical momentum make for a constructive setup: if Chainlink holds above $23, perhaps a move to $25.31 and $27 will take place before applying its larger uptrend and keep the market and project’s integrity intact.