
- FET is testing the lower boundary of its long-term ascending channel, indicating a possible shift in price direction.
- FET trading volume is increasing near the support zone, showing signs of active accumulation by market participants.
- Traders are waiting for a confirmed breakout from support before targeting the next resistance levels at $0.61 and $1.18.
Fetch.ai (FET) has once again caught the attention of traders as it tests the lower border of its ascending channel on the two-week chart. This technical setup has drawn increased interest from market participants who are monitoring whether the current decline could set the stage for a potential recovery.
FET Technical Outlook and Market Structure
Jonathan Carter shared an update suggesting that FET is approaching an area of support within its established channel. He described the current price zone as a heavy accumulation area with a recent rise in trading volume. According to his analysis, the structure of the channel remains intact, and a potential bounce could target levels at $0.61, $1.18, $3.08, and $13.00.
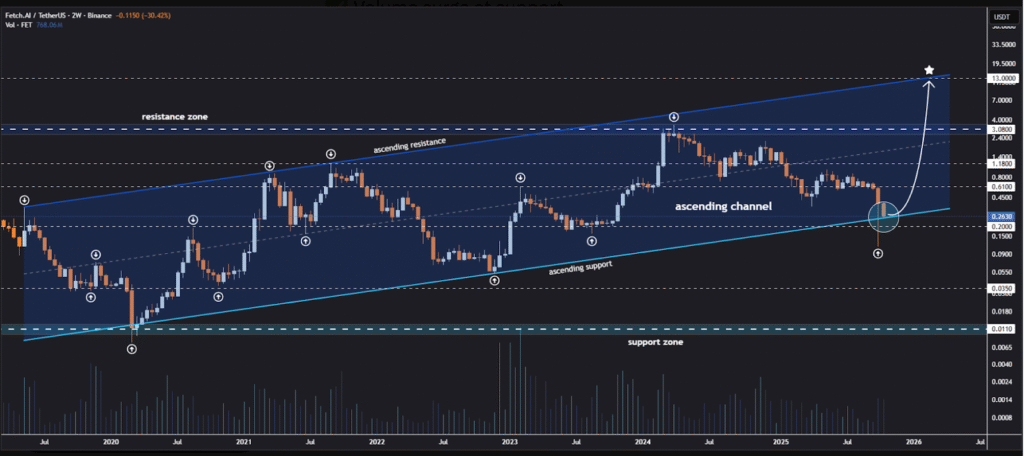
At the time of writing, FET is trading near $0.25 after a daily drop of about 6%. The cryptocurrency has been in a steady downtrend since its March 2024 peak near $3.00. Market analysts have noted that the lower boundary of the long-term channel has acted as a strong technical support level in the past. Traders are watching whether this level will hold again and lead to renewed buying interest.
Market Performance and Volume Activity
Fetch.ai’s market capitalization currently stands at around $599.72 million, supported by a circulating supply of 2.37 billion FET. Trading data shows a futures volume of $97.83 million and a spot volume of $27.22 million within the last 24 hours. Open interest is estimated at $62.86 million, which indicates active participation in derivative markets.
Over the past week, the Artificial Superintelligence Alliance, which includes Fetch.ai, has experienced a price decline of 36%. The token’s current value is about 93% below its all-time high reached in March 2024. Despite the correction, some traders view the lower levels as potential entry points due to increasing accumulation patterns around support zones.
Search interest for the project has also increased, with more than 15,000 searches recorded in the past week. Data shows a decline in both buying and selling percentages, suggesting that many participants are waiting for a clearer direction before entering new positions.
Broader Market Context and Future Levels
The recent weakness in FET’s price movement is not isolated. The broader digital asset market has seen similar pullbacks, as investors reassess risk amid global market uncertainty. Many mid-cap tokens have retraced sharply from their 2024 highs, reflecting a cautious sentiment.
Concurrently, analysts eye whether the price can sustain above the current support area. A confirmed bounce could push FET toward the short-term resistance zone near $0.61. A failure to hold support, however, could invite more selling pressure and extend the correction. The two-week timeframe remains a key reference for identifying the next move in the ongoing trend.
Market participants are closely watching volume activity and accumulation behavior as signals for potential recovery. If buying momentum continues to build at these levels, it may support the idea that the next upward phase is forming. For now, the channel structure and market reaction around support will likely determine the next direction for Fetch.ai’s price movement.