
- PEPE price is consolidating above the support price of 0.00000940, with the possible rebound levels at 0.00001020, 0.00001060, and 0.00001100.
- Outflows of exchange are over $2 million, which wipes out the available supply on order books and increases the probability of stronger upward movement when demand surges.
- TD Sequential and Oversold RSI indicate PEPE might soar back to the $0.00001044 mid-band, which supports the bullish attitude above the $0.00000940 support.
PEPE price action is at a decisive point, with bulls defending $0.00000940 support and preparing for a possible rally toward $0.00001100.
Bulls Defend a Key Support Zone
According to Ali, a market analyst on X, $PEPE is retesting the $0.00000940 support after a decline from $0.00001120 resistance. This level has been critical in previous rebounds, particularly in late August and early September, when price action recovered strongly.
The four-hour chart shows PEPE consolidating slightly above the support zone, hinting at accumulation. Dotted projections illustrate a likely pattern where the market could chop sideways before pushing higher. Immediate resistance is located around $0.00001020 and $0.00001060, respectively, with the primary upside target at $0.00001100.
If the support can withstand pressure, then this retracement could yield almost 17% in a rally. On the other hand, losing $0.00000940 could create a retracement into the support of $0.00000868 and weaken the current structure and shift momentum to sellers.
Exchange Outflows Add Strength to Bullish Case
Supporting this setup, exchange data shows that over $2 million worth of PEPE has recently been withdrawn from centralized platforms. Typically, such movements reduce sell-side pressure, as assets shifted to self-custody wallets are less likely to be sold quickly.
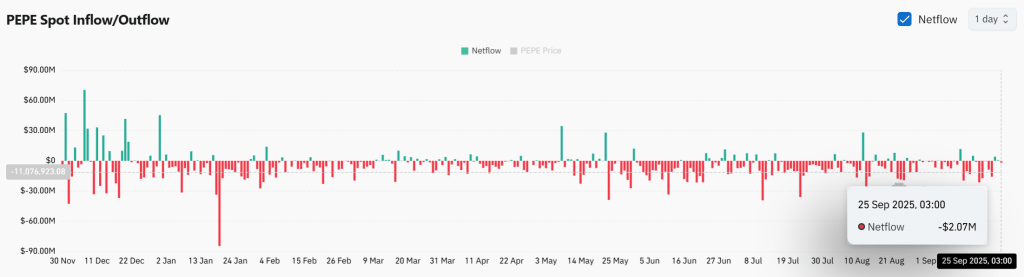
With supply on exchanges decreasing, potential demand shocks could drive sharper upside movements. The lack of liquidity tends to induce overreactions after buyers recover at important levels. This favors the optimistic position, provided that the bullish position is maintained at $0.00000940.
The withdrawals also suggest increasing investor confidence. Holders moving funds off exchanges often intend to secure their assets, indicating they may expect stronger valuations in the near future. This behavior strengthens the narrative that the current support could fuel a rebound.
Indicators Show Oversold Conditions and Possible Recovery
In another update, Ali highlighted that the TD Sequential indicator recently printed two buy signals on the PEPE daily chart. This technical development points toward a possible short-term reversal despite the broader bearish tone.
PEPE is currently testing the lower Bollinger Band, a traditional oversold marker that often precedes a move toward the middle band. The mid-band, aligned with the 20-day simple moving average, sits around $0.00001044 and represents the next resistance point for any recovery.
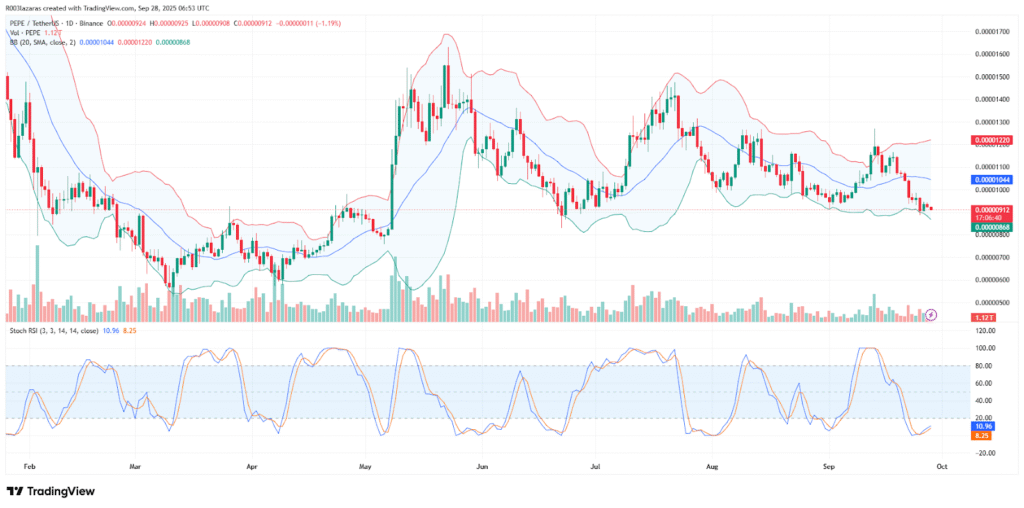
Meanwhile, the Stochastic RSI remains deeply oversold, with both %K and %D lines positioned below 20. A crossover here could trigger renewed buying activity. Provided $0.00000868 holds as a lower boundary, reclaiming $0.00000940 may set the stage for a run toward $0.00001100.