
- Sei breaks major descending resistance, signaling an early trend shift toward bullish continuation.
- Volume surge over 70% reflects renewed participation and stable liquidity support.
- Price holding above $0.20 suggests potential rally toward the $0.30 resistance level.
Sei ($SEI) is in the market with revived strength following a break above a crucial downward trendline and is a possible structural reversal. The investment has a positive short-term prognosis as it is maintaining the price at a level exceeding the key support as it is indicative of increasing investor confidence and involvement.
Breakout Above Resistance Marks Structural Reversal
The recent breakout in Sei ($SEI) represents a notable technical shift following several weeks of compressed trading activity. The asset successfully breached a descending resistance zone around the $0.20 mark, signaling the end of its prolonged corrective phase and suggesting a new accumulation phase may be underway.
The setup reflects the pattern observed on SEI/USDT charts shared across analyst discussions, where the token escaped a defined downtrend channel. The breakout candle closed staunchly above the resistance, confirming the existence of buying pressure at lower levels. The short-term setup is still positive and bullish for continuation as long as the price is above $0.20.
Sei has risen 1.67% over the past week and is now trading at $0.2046. Increased trading action is partnered with the breakout, and volume increases as additional proof that the market players are taking part actively.
Technical Targets Indicate Potential for 50% Move
The chart shared by Crypto Patel (@CryptoPatel) indicates a potential upside projection toward the $0.30 mark, representing an estimated 50% gain from current levels. The move stems from a measured breakout setup that often follows periods of extended correction and compressed volatility.
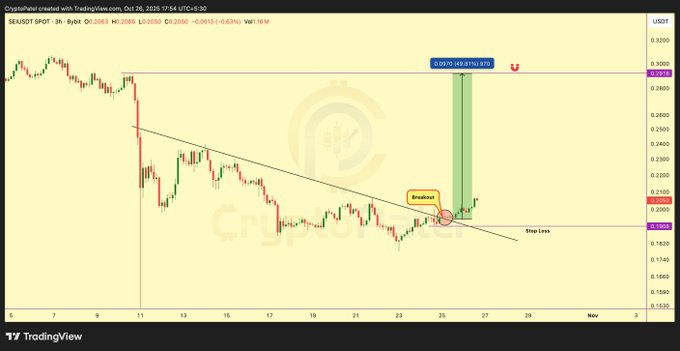
The structure shows Sei forming a higher low before breaking resistance — a classical reversal signal suggesting that selling momentum has weakened. A retest of the $0.20 level would serve as a healthy confirmation if buyers defend it as new support. Such behavior commonly validates a transition from bearish to bullish structure in early recovery phases.
Short-term resistances are seen at $0.24 and $0.26 ahead of a potential test of $0.30. It is required to keep on closing over $0.20 to continue the ongoing trend. Failure to do so could trigger renewed consolidation within the $0.18–$0.19 range before any further upside attempt.
Volume Expansion and Liquidity Support Strengthen Outlook
The latest market snapshot for Sei shows improving liquidity and rising investor engagement. Its market cap is $1.27 billion and its fully diluted capitalization is $2.04 billion. Because of an unexpected spike in market action, the 24-hour volume was up by 70% to $91.12 million.
The 7.16% Volume-to-Market Cap ratio indicates liquid market conditions, with efficient price discovery enabled by low volatility. Such liquidity conditions often accompany trend reversals, as participants position early in anticipation of continuation.
With a circulating supply of 6.24 billion out of a total 10 billion, Sei maintains a balanced supply framework conducive to stable market performance. The consistent structure above support and steady accumulation behavior reflect the early stages of a controlled recovery. In case of ongoing patterns, sustaining the rhythm over $0.22 may confirm a short-term bullish continuation while positioning for the $0.30 resistance zone.