
- SHIB is accumulating around a powerful long-term support level at $0.00001208 which has previously been defended by whales and long-term holders.
- Technical patterns have indicated that there is a possible inverse head and shoulders pattern with the break out levels falling in line with $0.00001400, $0.00001500 and $0.00001700.
- Potential recovery may be indicated by the oversold Stochastic RSI values, and a breakout of the falling trendline may verify the bullish reversal momentum.
Shiba Inu (SHIB) is consolidating at a key long-term support and is trading at $0.00001209. The market players are carefully observing how the set up is biased towards a possible bullish turnaround.
Buyers Defend a Key Support Zone
SHIB is at an important demand zone which has been in the past a springboard to rallies. Whenever the token has probed this area, the buyers have put a strong defence thus avoiding further losses to maintain the long-term bullish case.
Such an accumulation by whales and long-term holders is a sign of a steady accumulation, given this continuous defense at nearly 0.00001208. This zone has been resilient several times, indicating that traders consider it as a significant base of the subsequent price action. If preserved, it may provide the foundation for an upcoming upward trend.
Analyst SHIB Mortal said that SHIB remains bullish since it is consolidating above this high support. The common point of view emphasized the potential of the rounded bottom pattern or the inverse head-and-shoulders trend both of which frequently are followed by a long term bullish recovery.
Indicators Show Conflicting Signals
Technical indicators reveal mixed conditions for SHIB at the current stage. The Bollinger Bands indicate that the price action is being moved towards the bottom of the Bollinger Bands to the value of $0.00001176. The action is an indication of further bearish activity after the recent volatility and short-term pressure was put on the token.
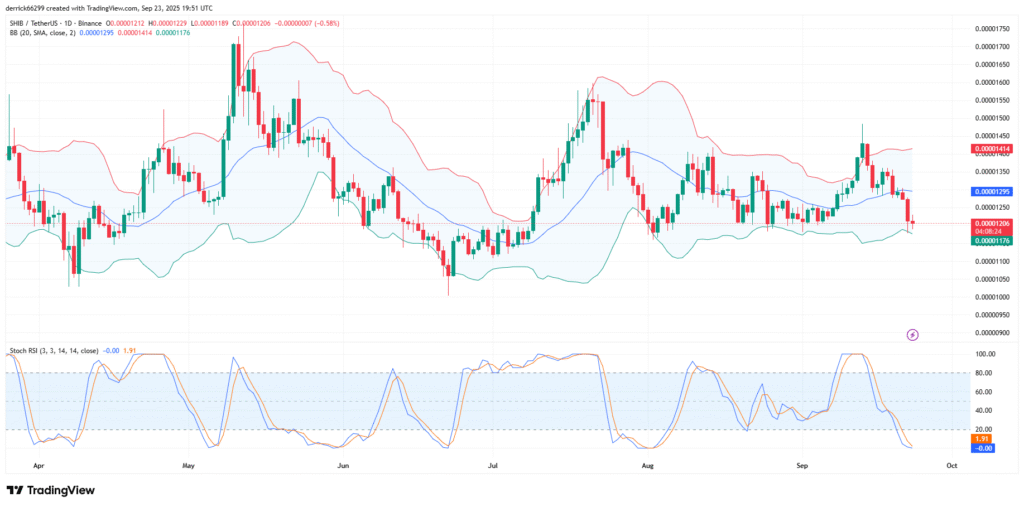
The 20-day simple moving average, located near $0.00001295, is now serving as immediate resistance. As long as the price remains below this mark, downside risk lingers in the market. Traders are cautious as the mid-band continues to cap upward attempts.
On the other hand, the Stochastic RSI is signaling exhaustion on the bearish side. The oscillator remains near zero, reflecting extreme oversold conditions. Such setups often lead to rebounds if buyers step in, especially if the indicator crosses upward from these levels.
Path Toward a Breakout
The market is now balancing between bearish continuation and bullish reversal potential. A daily close below the lower Bollinger Band could confirm renewed weakness, exposing the token to further downside. This would exert more strain on the support area.
On the other hand, over-selloff situations can trigger a recovery when buyers come back. The formation of a crossover on the Stochastic RSI could act as a technical trigger for recovery toward resistance levels.
The descending trendline overhead remains the decisive barrier. Breaking out of this level would affirm the thesis of reversal. Should this be done, SHIB may aim at price levels at $0.00001400, $0.00001500, and even greater at $0.00001700 as per the bullish expectations.