
- SuperVerse confirms hidden bullish divergence on the three-day chart, with momentum signaling potential continuation toward the $1.91 resistance target zone.
- The weekly chart shows a strong green candle above +30% gains as buyers defended the $0.50 base, reinforcing accumulation strength.
- Stochastic RSI crossed upward from oversold levels, aligning with bullish price structure, suggesting continuation toward $0.95, $1.45, and the key $1.91 target.
SuperVerse (SUPER) is gaining momentum after confirming a hidden bullish divergence, raising expectations of an extended recovery with upside potential beyond recent resistance zones.
Hidden Bull Divergence Strengthens Bullish Case
A tweet from market analyst JAVONMARKS pointed out that SuperVerse surged after confirming a hidden bullish divergence on the three-day chart. This continuation pattern often suggests that bullish momentum remains intact despite corrective moves, supporting expectations of further gains.
Price action shows SUPER defending its horizontal support multiple times, with equal lows indicating firm buying interest. A recent strong green candle from this area suggests that accumulation pressure has intensified, creating conditions for a sustained breakout.
Analysts now watch the $1.91 resistance level, which aligns with previous distribution highs. If breached, the move could extend toward $3.70, reflecting a potential +138% rise from current levels.
Support Base and Accumulation Structure
The broader structure reflects a transition from the 2022 downtrend into a developing accumulation phase. SUPER has repeatedly held support near $0.50, building a base that has attracted buyers during recent pullbacks.
This stable foundation has allowed the market to stabilize while providing confidence for traders looking for continuation setups. The repeated defenses around $0.50 highlight its importance as a critical zone.
With the hidden bullish divergence still valid, market signals point to a possible expansion phase. As long as the base structure holds, the path toward prior highs and beyond $1.91 remains in play.
Weekly Chart Points to Renewed Momentum
On the weekly timeframe, SuperVerse recently printed a strong green candle with gains above +30%, reflecting intensified demand at the $0.50 zone. This rally coincided with a retest of the 20-week EMA, positioned around $0.6683, which is often a pivot for trend continuation.
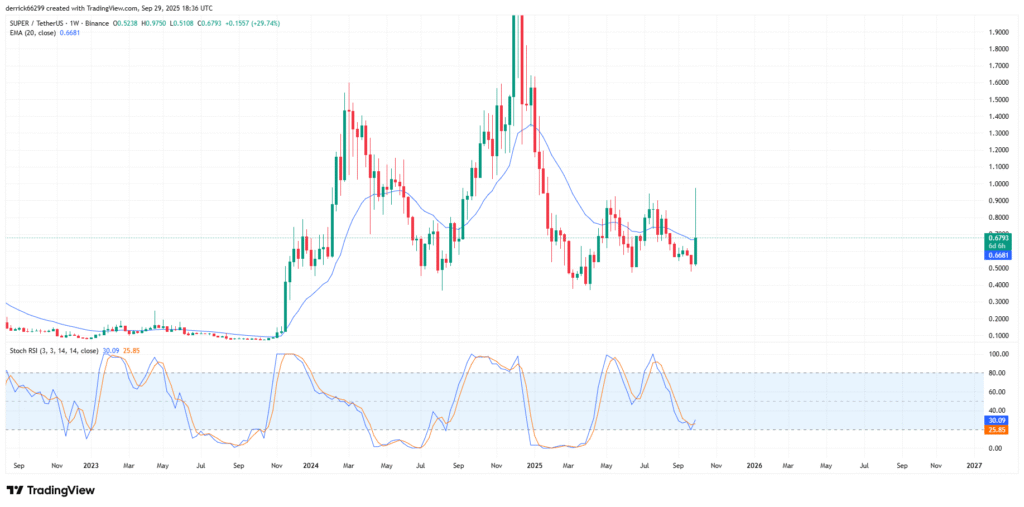
The Stochastic RSI also confirmed the shift, crossing higher from the oversold band near 25–30. This indicator reset, paired with price expansion, has historically preceded multi-week rallies when supported by volume.
Resistance is currently in the $0.95–$1.00 region, followed by a more serious resistance around $1.45. Further closes above the $0.68–$0.70 level could enhance the foundation for a breakout above $1, with the $1.91 target once again in contention.