
- The golden cross on the third step on the altcoin market cap chart heralds the possible bullish direction of the changes in trend.
- Golden crosses occurred in 2024 and 2025 and also resulted in months-long altcoin surges, which further enhances the validity of the current signal.
- The altcoin market is about to reach a vital resistance level that could, in turn, allow additional capital inflow to the market under the condition of being broken.
The market capitalization of all cryptocurrencies other than Bitcoin and Ethereum, called the TOTAL3 chart, has created a new golden cross. The technical pattern is where a short-term (say the 50-day) moving average is crossed above a long-term (say the 200-day) one.
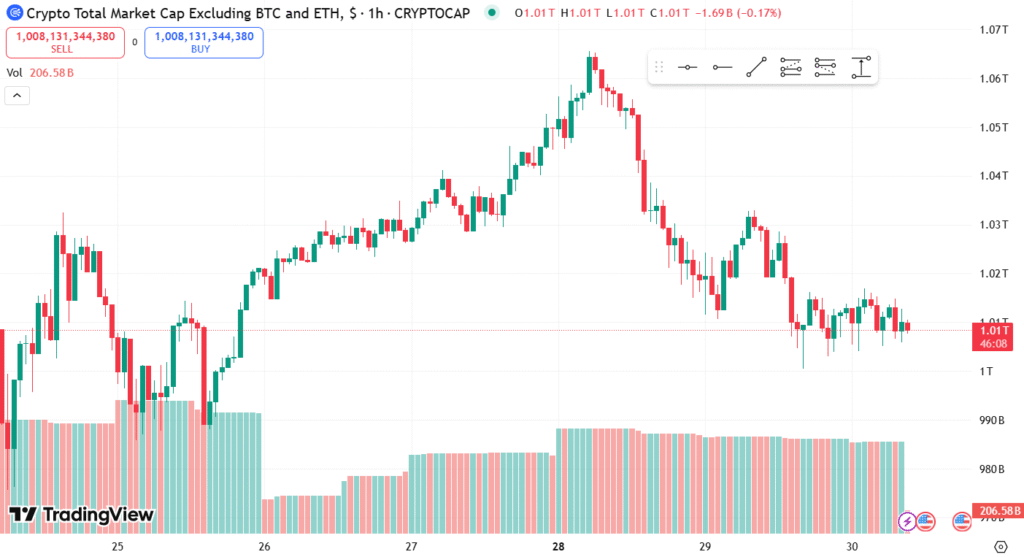
Source: TradingView
The financial markets tend to interpret the crossover as being bullish. In the present case, it may imply increased activities in the altcoin market. Today, the TOTAL3 chart reflects the third such formation in history and is preceded by all previous robust activity in the market. All of these past occurrences caused altcoin multi-month rallies that moved the total valuations into the stratosphere.
Historical Background Enhances Bull Setup
Previous data are used to justify the current technical signal. In 2024 and early 2025, on the same graph, there were some other similar golden crosses. Market capitalization of the altcoins in both of those cases increased significantly within the next months, which suggests that this is a normal pattern of momentum after the crossover.
Another point that is emphasized in the chart is the V-shaped recovery into the crossover. This indicates more involvement and turnover, which means a great interest on the part of market participants. The visual pattern has green arrows pointing upwards, and this is what happened in the past bullish reactions and gives a background to what is happening in the current price action.
Altcoin Market Nears Crucial 1 Trillion Mark
Altcoins are now classified as having a total market cap striving towards the mark of $1 trillion. This is both a psychological and technical pressure point for a great number of investors. Moving above that may spur the demand and resulting expansions in altcoins.
Such developments are usually monitored by traders in order to validate possible changes in trends. In case of continued purchase pressure, the chart can indicate the outset of a prolonged cyclical trend upwards in the altcoin industry.