
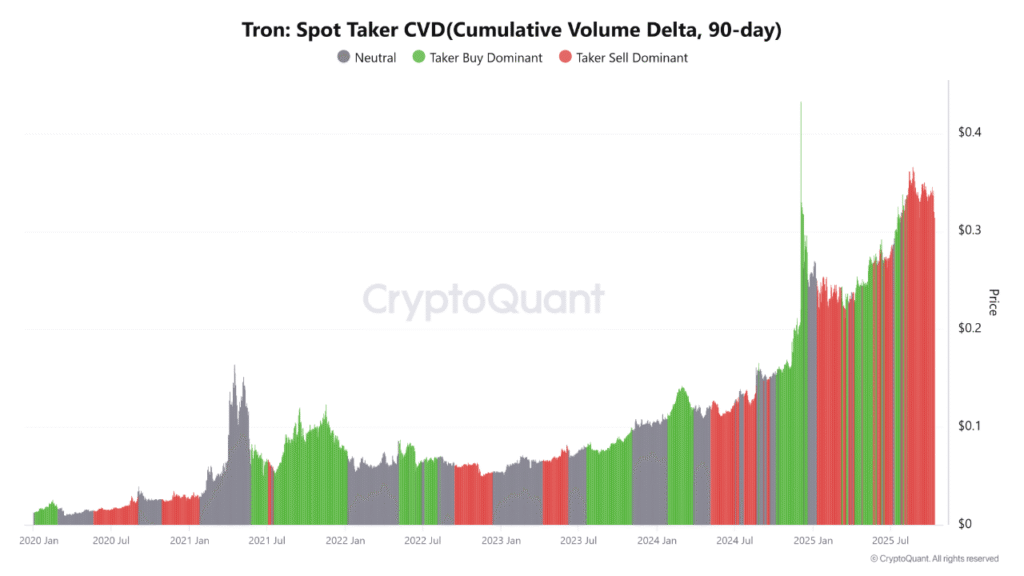
- TRX maintains stability around $0.30–$0.35 despite high sell volumes, indicating accumulation by large buyers and weakening downward momentum.
- The $0.27–$0.29 range serves as strong support, while CVD signals and price behavior suggest a new bullish trend forming.
- Breaks above $0.37 could confirm trend reversal, with resistance targets at $0.40–$0.50 offering gradual upside for long-term investors.
Tron (TRX) has remained fairly stable amidst prolonged selling pressure, which is suggestive of accumulation and a soon-to-happen recovery in the market. Price has largely traded between the $0.30–$0.35 zone since mid-2025.
Prolonged Selling Pressure and Market Stability
Intensive selling pressure on TRX has been observed since mid-2025, and has been accompanied by consistent liquidity outflows and domination of the sell-side. In spite of these tensions, the token is yet to be supported on the $0.30-0.35 range. This shows that bearish momentum is already dead, and larger sellers may have lost positions.
Stable prices during periods of high selling often reflect a stage where buyers begin to regain control. TRX’s price behavior suggests that selling pressure is being absorbed by larger players. Gradual absorption of sell volumes typically signals accumulation by long-term holders.
A recent tweet by PelinayPA noted, “Despite heavy selling, TRX remains stable, signaling that large players may be quietly absorbing supply for long-term gains.” This supports the view that the market may have found a local bottom.
Accumulation Zones and Potential Upside
Technical analysis identifies the $0.27–$0.29 zone as a major accumulation area, where heavy sell-offs were absorbed. This range provides a strong support level for potential recovery phases. Extreme market reactions may push prices toward $0.23–$0.25, but this remains a low-probability scenario.
TRX’s market shows early signs of neutralization, where buyers gradually regain dominance. When the price clings to the position above the value of $0.30, it may be a sign that the market is ready to take an upward trend. This given range is usually an early indicator of a fresh bullish trend due to stable trading.
As CVD data turns positive, TRX may target resistance levels around $0.35–$0.37. Gradual extensions toward $0.40–$0.50 are possible if buy-side pressure strengthens. The $0.40–$0.50 zone is the next potential upside target.
Technical Signals for a Trend Reversal
A close above 0.37 would be a sign that the trend has reversed. Green zones regaining their positions on the charts can be observed by the market members as the first signs of a new bullish trend. A breakout above these resistance levels could attract additional accumulation.
CVD analysis suggests that TRX has already formed its local bottom. Once buyers regain dominance, the market may consolidate between $0.28–$0.35, forming a new balance zone. Consolidation at these levels provides stability before further upward movements.
Temporary declines below 0.27 can be regarded by the traders as a possible long-term entry point. These levels may be counterfeit disintegrations, and they offer appealing risk-to-compensation arrangements. The gradual shift from absorption to buying pressure indicates a measured and steady recovery.