
- XLM’s weekly chart mirrors 2017’s wedge breakout pattern, hinting at a potential macro rally.
- Post-breakout compression zone and bullish flag formation strengthen the bullish thesis.
- On-chain data shows Stellar’s DeFi ecosystem surging,and supporting long-term price growth.
Stellar (XLM) is trading at $0.3817 as at writing time, this is after slipping 4% in the last 24 hours. The past week shows a modest dip, but investors are watching closely as technical levels take shape.
A Familiar Setup Returns for XLM in Q4
History doesn’t always repeat, but sometimes it rhymes—and Stellar’s current chart is sounding a lot like late 2017. A prolonged descending wedge, a clean breakout, and a consolidation flag: the same sequence that led to XLM’s historic rally is now taking shape once again.
Shared by EtherNasyonaL,is a side-by-side comparison of the 2017 and 2025 weekly charts that shows striking technical symmetry. In both cases, the price started from a rising trendline, then broke out and took a pause inside a downward-sloping flag pattern.
In 2017, that setup fueled a parabolic move,and now, in Q4 2025, the structure looks nearly identical. Stellar is currently trading around $0.38891, a price level that closely matches its post-flag consolidation zone from 2017.
A shaded compression zone—marked on both charts—suggests the market may be coiling before its next move. If the past is any guide, this type of setup could lead to another explosive rally.
DeFi Growth Adds Fuel to the Fire
According to DeFiLlama, Stellar’s DeFi ecosystem has undergone a major shift ,from $10 million in TVL during 2023, the network has ballooned past $150 million by Q4 2025.
That’s more than a 7x jump—driven by increased liquidity, new protocol launches, and stronger investor participation.Unlike flash-in-the-pan surges, this TVL growth has held strong.
Higher highs continue across 2025, indicating sticky capital and active user engagement. This isn’t just short-term speculation—it reflects real ecosystem expansion.For traders and investors, that matters.
TVL is often a leading indicator of network health. And with Stellar showing both technical and on-chain momentum, the bullish case is building.
Short-Term Moves Worth Watching
Looking closer, XLM has pulled back after reaching $0.4150 earlier this month. It dropped to around $0.3750 before bouncing a bit. The 9-period EMA at $0.3845 is just above the price and acting as resistance.
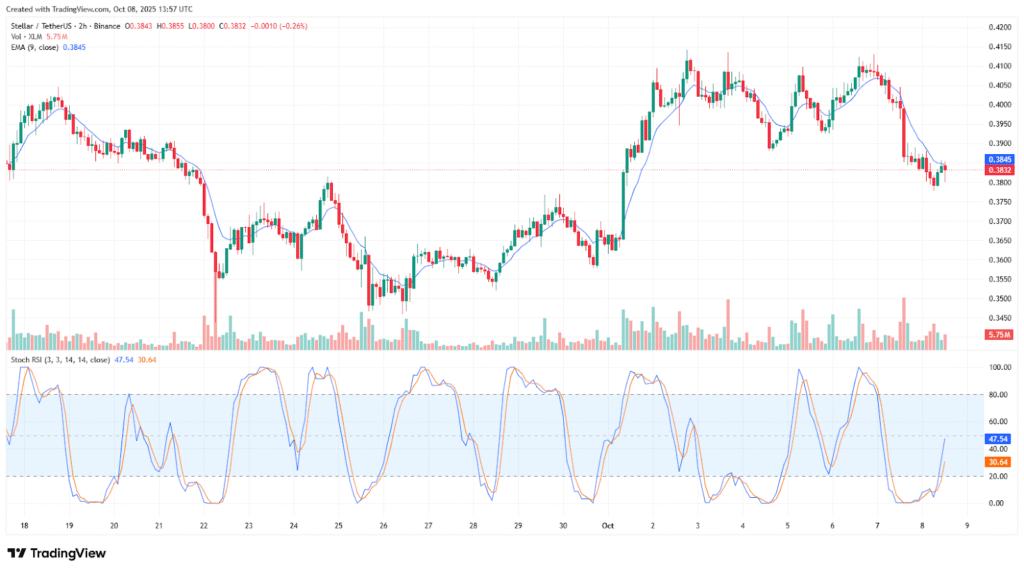
Momentum indicators like the Stochastic RSI are moving up from oversold levels. A crossover between %K and %D is happening, showing a possible bounce.
If the price breaks above$0.3950, it could start the next upward move,until then, the price might stay sideways or dip lower again.